The State of Carrier Entry: August 2026
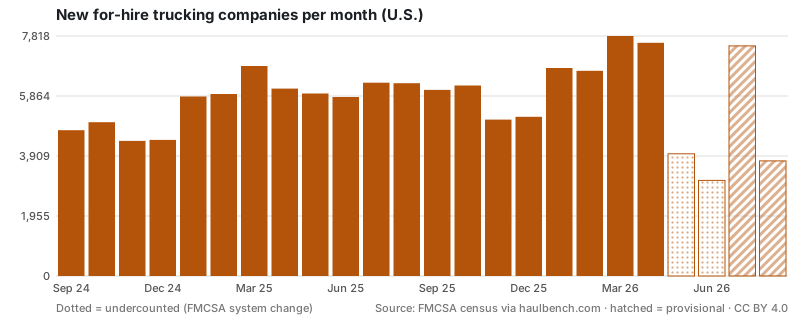
Every month FMCSA issues USDOT numbers to thousands of new for-hire trucking companies. This report tracks that flow of new entrants nationally and by state, from the agency's own registration census, and updates automatically as the data changes. Over the last twelve months 69,762 new for-hire carriers with operating authority entered the market, +19% over the 8 complete months to April 2026 versus the same months a year earlier, and 48,132 of them (69%) started with a single truck. That twelve-month count includes 2 months the census undercounts, so it is a floor: see the note below. The three complete months to April 2026 averaged 7,366 per month, +30% versus the prior three and +17% versus the same period a year earlier; the averages use complete months only, skipping the two most recent (provisional) and any month noted below as undercounted.
Key findings
- Fastest-growing states (8 complete months vs the same months a year earlier): South Dakota +49%, Louisiana +40%, Alabama +39%, New Hampshire +37%, Vermont +36%.
- Shrinking fastest: Hawaii −69%, Alaska −17%, California −6%, Delaware +2%, Connecticut +3%.
- Highest entry rate (new carriers per 1,000 active, 12 months): District of Columbia 153, Rhode Island 125, Pennsylvania 120, New Jersey 119, Connecticut 114.
- Largest by volume (12 months, a floor: see the undercount note): Texas 8,482, California 6,870, Florida 5,760, Illinois 3,594, Pennsylvania 3,458.
All states, last 12 months
| State | Last 12 mo (floor) | Prior 12 mo | Change (8 complete mo) | Active carriers | Entry rate / 1,000 |
|---|---|---|---|---|---|
| Texas | 8,482 | 8,024 | +26% | 81,151 | 104.5 |
| California | 6,870 | 7,587 | −6% | 85,829 | 80.0 |
| Florida | 5,760 | 5,377 | +21% | 50,600 | 113.8 |
| Illinois | 3,594 | 3,352 | +23% | 36,278 | 99.1 |
| Pennsylvania | 3,458 | 3,125 | +29% | 28,707 | 120.5 |
| Georgia | 3,442 | 3,421 | +20% | 35,869 | 96.0 |
| Ohio | 3,137 | 2,861 | +21% | 27,688 | 113.3 |
| New Jersey | 2,772 | 2,680 | +20% | 23,318 | 118.9 |
| North Carolina | 2,577 | 2,604 | +19% | 24,885 | 103.6 |
| Indiana | 1,889 | 1,831 | +21% | 17,025 | 111.0 |
| New York | 1,676 | 1,659 | +16% | 19,059 | 87.9 |
| Virginia | 1,521 | 1,442 | +24% | 14,265 | 106.6 |
| Michigan | 1,473 | 1,403 | +22% | 15,088 | 97.6 |
| Maryland | 1,468 | 1,401 | +22% | 13,704 | 107.1 |
| Tennessee | 1,450 | 1,377 | +27% | 13,768 | 105.3 |
| South Carolina | 1,323 | 1,382 | +14% | 12,666 | 104.5 |
| Arizona | 1,321 | 1,134 | +34% | 12,610 | 104.8 |
| Minnesota | 1,166 | 1,070 | +14% | 14,646 | 79.6 |
| Missouri | 1,128 | 1,048 | +28% | 12,558 | 89.8 |
| Washington | 1,080 | 1,142 | +7% | 15,296 | 70.6 |
| Alabama | 1,016 | 914 | +39% | 10,624 | 95.6 |
| Massachusetts | 999 | 978 | +17% | 10,037 | 99.5 |
| Colorado | 982 | 1,000 | +10% | 11,274 | 87.1 |
| Kentucky | 928 | 820 | +26% | 8,499 | 109.2 |
| Wisconsin | 826 | 834 | +13% | 12,108 | 68.2 |
| Oklahoma | 792 | 748 | +27% | 8,207 | 96.5 |
| Mississippi | 768 | 782 | +28% | 7,612 | 100.9 |
| Connecticut | 702 | 725 | +3% | 6,163 | 113.9 |
| Nevada | 690 | 702 | +8% | 6,224 | 110.9 |
| Louisiana | 678 | 581 | +40% | 6,229 | 108.8 |
| Utah | 598 | 556 | +30% | 6,554 | 91.2 |
| Iowa | 555 | 532 | +21% | 9,628 | 57.6 |
| Oregon | 555 | 541 | +14% | 7,639 | 72.7 |
| Arkansas | 525 | 481 | +35% | 5,907 | 88.9 |
| Kansas | 436 | 478 | +7% | 6,343 | 68.7 |
| Nebraska | 424 | 367 | +31% | 6,495 | 65.3 |
| Idaho | 395 | 396 | +17% | 5,223 | 75.6 |
| New Mexico | 354 | 373 | +20% | 4,100 | 86.3 |
| Delaware | 305 | 354 | +2% | 2,705 | 112.8 |
| Wyoming | 238 | 216 | +36% | 2,640 | 90.2 |
| North Dakota | 209 | 198 | +18% | 3,376 | 61.9 |
| New Hampshire | 203 | 171 | +37% | 1,977 | 102.7 |
| Rhode Island | 200 | 183 | +28% | 1,605 | 124.6 |
| South Dakota | 179 | 143 | +49% | 3,025 | 59.2 |
| Montana | 174 | 174 | +19% | 2,747 | 63.3 |
| West Virginia | 173 | 173 | +24% | 2,177 | 79.5 |
| Maine | 119 | 124 | +19% | 2,224 | 53.5 |
| Vermont | 62 | 65 | +36% | 886 | 70.0 |
| District of Columbia | 51 | 50 | +10% | 334 | 152.7 |
| Alaska | 29 | 43 | −17% | 705 | 41.1 |
| Hawaii | 10 | 45 | −69% | 316 | 31.6 |
Use this data
Everything on this page is free to reuse under CC BY 4.0: cite “HaulBench, from FMCSA census data” and link to this page.
- Chart image: /embed/new-carriers.svg (SVG, updates monthly)
- Embed the live chart:
<iframe src="https://haulbench.com/embed/new-carriers/" width="800" height="340" style="border:0;max-width:100%" loading="lazy" title="New trucking companies per month, U.S."></iframe>
- JSON: /data/new-carriers.json (national and by state, 24 months) · /data/diesel.json (weekly diesel by region)
- Press: contact us for custom cuts (by fleet size, by county) or comment on trends.
May 2026 and June 2026 are undercounted. FMCSA moved carrier registration to a new system on 2026-05-14 and stopped writing the MC docket into the census for several weeks. This series counts carriers that carry a docket, so those months show roughly half their true entries; the underlying registration rate did not change. The headline averages on this page skip them, and the monthly table marks them. Treat any average spanning the cutover as a floor rather than a measurement.
Method
Source: FMCSA Company Census File (data.transportation.gov), reloaded monthly. A "new carrier" is an active, US-based entity with an MC docket whose USDOT number was issued in the month shown. Carriers that later go inactive drop out of the census, so older months understate original entries slightly; the two most recent months are provisional because of census lag and the delay in MC docket assignment. Entry rate divides 12-month entries by currently active carriers in the state. 2026 month-to-month swings coincide with FMCSA's registration-system migration; trends are best read on 3- and 12-month windows.
Last updated 2026-09-08 · first published 2026-09-07. Data sources are listed on each page; see About for methodology.